0%

线性回归实战——波士顿房价预测

利用马萨诸塞州波士顿郊区的房屋信息数据,使用线性回归模型训练和测试一个房价预测模型,并对模型的性能和预测能力进行测试分析。使用的编程语言是python,主要使用了pandas、matplotlib、sklearn这几个包。

导入数据

Boston房价数据下载地址,提取码:nefu

1
2
3
4
5
6
7
8
9
10
11
12
13
14
import pandas as pd

# 载入波士顿房屋的数据集

data = pd.read_csv('Boston.csv')
# print(data)
# print(type(data))
Y = data['MEDV']
X = data.drop('MEDV', axis=1)
# print(Y)
# print(X)
# 完成
# print(X.shape) # 输出数据集的样本数,每个样本的特征数
# print(X.iloc[0]) # 查看第一个数据

数据分析

加载数据后,不要直接急匆匆地上各种处理手段,加各种模型,先慢一点,对数据进行一个初步的了解,了解其各个特征的统计值、分布情况、与目标特征的关系,最好进行可视化,这样会看到很多意料之外的东西。

基础统计运算

统计运算用于了解某个特征的整体取值情况,它的最大最小值,平均值中位数,百分数,这些都是最简单的对一个字段进行了解的手段。

1
2
3
# print(data.describe()) # 可以查看各个特征取值的情况,最小值,最大值,均值,方差等
# print(data.head()) # 查看前5个数据
# print(data.dtypes) # 可以查看样本的属性名及数据类型

特征观察

这里主要考虑各个特征与目标之间的关系,比如是正相关还是负相关,通常都是通过对业务的了解而来的,这里就延申出一个点,机器学习项目通常来说,对业务越了解,越容易得到好的效果,因为所谓的特征工程其实就是理解业务、深挖业务的过程。
比如这个问题中的三个特征:

  1. RM:房间个数明显应该是与房价正相关的;
  2. LSTAT:低收入比例一定程度上表示着这个社区的级别,因此应该是负相关;
  3. PTRATIO:学生/教师比例越高,说明教育资源越紧缺,也应该是负相关;

上述这三个点,同样可以用可视化的方式来验证,事实上也应该去验证而不是只靠主观猜想,有些情况下,主观感觉与客观事实是完全相反的,这里要注意。


数据划分

为了验证模型的好坏,通常的做法是进行 cv,即交叉验证,基本思路是将数据平均划分 N 块,取其中 N-1 块训练,并对另外 1 块进行做预测,并对比预测结果与实际结果,这个过程反复 N 次直到每一块都作为验证数据使用过。

1
2
3
4
5
6
7
from sklearn.model_selection import train_test_split

X_train, X_test, y_train, y_test = train_test_split(X, Y, test_size=0.2, random_state=42)
# print(X_train.shape) # (404, 13)
# print(X_test.shape) # (102, 13)
# print(y_train.shape) # (404)
# print(y_test.shape) # (102)

定义评价函数

这里主要是根据问题来定义,比如分类问题用的最多的是准确率(精确率、召回率也有使用,具体看业务场景更重视什么),回归问题用 RMSE (均方误差) 等等,实际项目中会根据业务特点定义评价函数。


模型训练

1
2
3
4
5
6
7
8
9
10
11
12
import time
from sklearn.linear_model import LinearRegression

model = LinearRegression()

start = time.process_time()
model.fit(X_train, y_train)

train_score = model.score(X_train, y_train) # 采用R2为评价函数
cv_score = model.score(X_test, y_test)
print('elaspe: {0:.6f}; train_score: {1:.6f}; cv_score: {2:.6f}'.format(time.process_time() - start, train_score,
cv_score))

从结果可以看出,模型拟合效果一般,所以还需要进行模型优化。


模型调优

首先观察一下数据,特征数据的范围相差比较大,最小的在10^-3^级别,而最大的在10^2^级别,所以需要数据归一化处理。

1
2
3
4
5
6
7
8
9
10
11
from sklearn.pipeline import make_pipeline
from sklearn.preprocessing import StandardScaler

linear_regression = make_pipeline(StandardScaler(with_mean=False), LinearRegression())
start = time.process_time()
linear_regression.fit(X_train, y_train)

train_score = linear_regression.score(X_train, y_train)
cv_score = linear_regression.score(X_test, y_test)
print('elaspe: {0:.6f}; train_score: {1:.6f}; cv_score: {2:.6f}'.format(time.process_time() - start, train_score,
cv_score))

从之前的训练分数上来,可以观察到数据对训练样本数据的评分比较低,即数据对训练数据的欠拟合。所以可以通过低成本的方案,即增加多项式特征看能否优化模型的性能。增加多项式特征,其实就是增加模型的复杂度。
编写创建多项式模型的函数

1
2
3
4
5
6
7
8
9
10
11
12
from sklearn.preprocessing import PolynomialFeatures
from sklearn.pipeline import Pipeline


def polynomial_model(degree=1):
polynomial_features = PolynomialFeatures(degree=degree,
include_bias=False)
linear_regression = make_pipeline(StandardScaler(with_mean=False), LinearRegression())
pipeline = Pipeline([("polynomial_features",
polynomial_features),
("linear_regression", linear_regression)])
return pipeline

接着使用二阶多项式来拟合数据:

1
2
3
4
5
6
7
8
model = polynomial_model(degree=2)

start = time.process_time()
model.fit(X_train, y_train)
train_score = model.score(X_train, y_train)
cv_score = model.score(X_test, y_test)
print('elaspe: {0:.6f}; train_score: {1:.6f}; cv_score: {2:.6f}'.format(time.process_time() - start, train_score,
cv_score))

从训练分数和测试分数都提高了,看来模型缺失得到了优化。我们可以把多项式改为三阶看一下结果,从结果可以看出出现了过拟合。


学习曲线

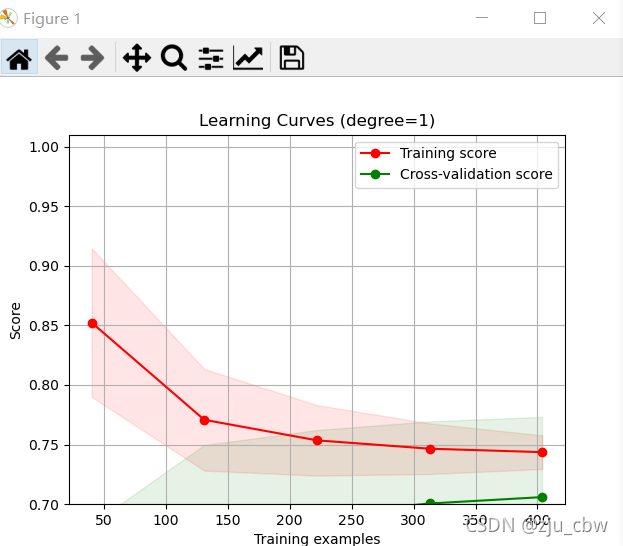
更好的方法是画出学习曲线,这样对模型的状态以及优化方向一目了然。

  1. 首先编写 utils,py
1
2
3
4
5
6
7
8
9
10
11
12
13
14
15
16
17
18
19
20
21
22
23
24
25
26
27
28
29
30
31
32
33
34
35
36
37
38
39
40
41
42
43
44
45
46
47
48
49
50
51
52
53
54
55
56
57
import numpy as np
import matplotlib.pyplot as plt
from sklearn.naive_bayes import GaussianNB
from sklearn.svm import SVC
from sklearn.datasets import load_digits
from sklearn.model_selection import learning_curve
from sklearn.model_selection import ShuffleSplit


def plot_learning_curve(estimator, title, X, y, ylim=None, cv=None,
n_jobs=1, train_sizes=np.linspace(.1, 1.0, 5)):
plt.figure()
plt.title(title)
if ylim is not None:
plt.ylim(*ylim)
plt.xlabel("Training examples")
plt.ylabel("Score")
train_sizes, train_scores, test_scores = learning_curve(
estimator, X, y, cv=cv, n_jobs=n_jobs, train_sizes=train_sizes)
train_scores_mean = np.mean(train_scores, axis=1)
train_scores_std = np.std(train_scores, axis=1)
test_scores_mean = np.mean(test_scores, axis=1)
test_scores_std = np.std(test_scores, axis=1)
plt.grid()

plt.fill_between(train_sizes, train_scores_mean - train_scores_std,
train_scores_mean + train_scores_std, alpha=0.1,
color="r")
plt.fill_between(train_sizes, test_scores_mean - test_scores_std,
test_scores_mean + test_scores_std, alpha=0.1, color="g")
plt.plot(train_sizes, train_scores_mean, 'o-', color="r",
label="Training score")
plt.plot(train_sizes, test_scores_mean, 'o-', color="g",
label="Cross-validation score")

plt.legend(loc="best")
return plt


if __name__ == '__main__':
digits = load_digits()
X, y = digits.data, digits.target # 加载样例数据

# 图一
title = r"Learning Curves (Naive Bayes)"
cv = ShuffleSplit(n_splits=100, test_size=0.2, random_state=0)
estimator = GaussianNB() # 建模
plot_learning_curve(estimator, title, X, y, ylim=(0.7, 1.01), cv=cv, n_jobs=1)

# 图二
title = r"Learning Curves (SVM, RBF kernel, $\gamma=0.001$)"
cv = ShuffleSplit(n_splits=10, test_size=0.2, random_state=0)
estimator = SVC(gamma=0.001) # 建模
plot_learning_curve(estimator, title, X, y, (0.7, 1.01), cv=cv, n_jobs=1)

plt.show()

  1. 导入utilsplot_learing_curve,并分别绘制,一阶,二阶,三阶多项式的训练误差以及交叉验证误差的图像。
1
2
3
4
5
6
7
8
9
10
11
12
13
14
15
16
17
18
19
from utils import plot_learning_curve
from sklearn.model_selection import ShuffleSplit
import matplotlib.pyplot as plt

cv = ShuffleSplit(n_splits=100, test_size=0.2, random_state=0)
title = 'Learning Curves (degree={0})'
degrees = [1, 2, 3]

start = time.process_time()
# plt.figure(figsize=(18, 4), dpi=200)
for i in range(len(degrees)):
# print(i+1)
# print(degrees[i])
# plt.subplot(1, 3, i+1)
plot_learning_curve(polynomial_model(degrees[i]), title.format(degrees[i]), X, Y, (0.7, 1.01), cv=cv, n_jobs=1)
print('elaspe: {0:.6f}'.format(time.process_time() - start))

plt.show()

一阶
二阶
三阶
我们可以清楚的看到,一阶欠拟合,二阶是最好的,三阶过拟合。


手写版线性回归

再附一个没有用 sklearn 科学包的版本,有兴趣的可以自己研究一下。

1
2
3
4
5
6
7
8
9
10
11
12
13
14
15
16
17
18
19
20
21
22
23
24
25
26
27
28
29
30
31
32
33
34
35
36
37
38
39
40
41
42
43
44
45
46
47
48
49
50
51
52
53
54
55
56
57
58
59
60
61
62
63
64
65
66
67
68
69
70
71
72
73
74
75
76
import numpy as np
import pandas as pd
import matplotlib.pyplot as plt


# 划分训练集和测试集
def train_test_split(X, Y, test_size=0.25, random_state=None):
X_test = X.sample(frac=test_size, random_state=random_state)
X_test = X_test.sort_index()
Y_test = Y[X.index.isin(X_test.index)]
X_train = X[~X.index.isin(X_test.index)]
Y_train = Y[~Y.index.isin(Y_test.index)]
return X_train, Y_train, X_test, Y_test


# 计算均方误差
def cal_cost(W, x, y):
y_hat = np.matmul(x, W)
temp = np.matmul((y_hat - y).T, (y_hat - y))
return temp / (2 * y.size)


# 最小-最大标准化
def uniform_norm(x):
X_max = np.amax(x, axis=0)
X_min = np.amin(x, axis=0)
uni_train_x = (x - X_min) / (X_max - X_min)
return uni_train_x, X_max, X_min


# 训练模型
def train(W, x, y, iterations=100000, learn=0.001, threshold=1e-6, lamda=0.03):
error = np.empty(0)
for i in range(iterations):
y_hat = np.matmul(x, W)
W = W - learn * (np.matmul(x.T, np.matmul(x, W)-y) / y.size + lamda*W)
if (i + 1) % 100 == 0:
error = np.insert(error, error.size, values=cal_cost(W, x, y)[0][0])
if error.size > 2 and error[-2] - error[-1] < threshold:
break
return W, error


data = pd.read_csv('Boston.csv')

Y = data['MEDV']
X = data.drop('MEDV', axis=1)

X_train, Y_train, X_test, Y_test = train_test_split(X, Y, test_size=0.2, random_state=42)

x_train = np.array(X_train)
y_train = np.array(Y_train)
x_test = np.array(X_test)
y_test = np.array(Y_test)

uni_train_x, X_max, X_min = uniform_norm(x_train)
uni_test_x = (x_test - X_min) / (X_max - X_min)

uni_train_x = np.insert(uni_train_x, 0, values=np.ones(uni_train_x.shape[0]), axis=1)
uni_test_x = np.insert(uni_test_x, 0, values=np.ones(uni_test_x.shape[0]), axis=1)

y_train = np.resize(y_train, (y_train.size, 1))
y_test = np.resize(y_test, (y_test.size, 1))
W = np.zeros(X.shape[1] + 1)
W = np.resize(W, (W.size, 1))

W, error = train(W, uni_train_x, y_train)

# 绘图
plt.plot(error)
plt.show()

# 计算测试集误差
test_error = cal_cost(W, uni_test_x, y_test)
print("测试集误差为 " + str(test_error[0][0]))

-------------本文结束感谢您的阅读-------------